Graphed Metrics
The following different graph types visualise metric data for your functions. The data resolution adjusts automatically to suit the selected time range.
On smaller screen sizes, you can switch between these graphs using the buttons below the graph.
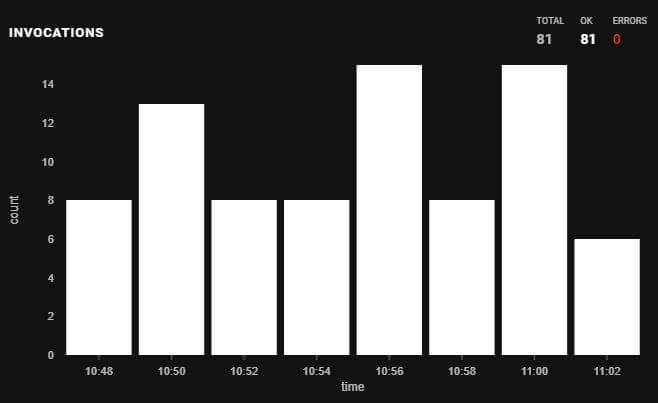
Invocations

This graph shows the count of the number of successful and errored invocations. If a function's result status is unknown, it is shown in this graph as a successful invocation.
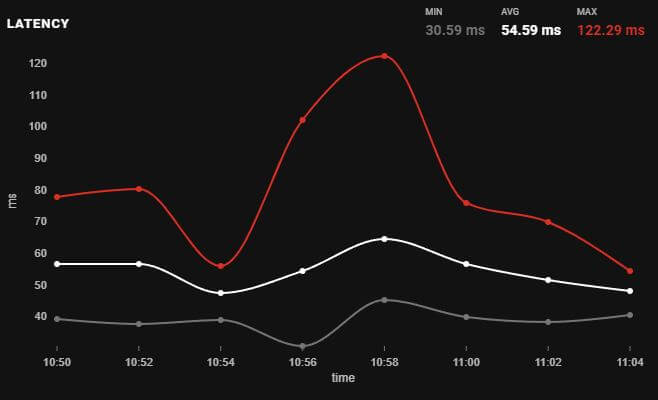
Latency

This graph shows minimum, average and maximum function execution time in milliseconds.
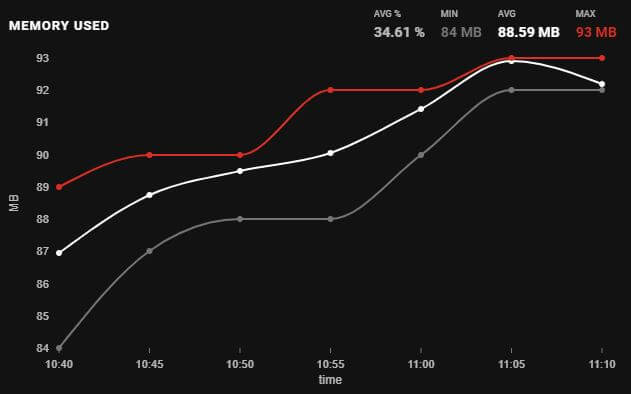
Memory Used

This graph shows minimum, average and maximum Lambda memory use over time.
If more than one function's metrics are being plotted, the memory use is displayed as a percentage. Otherwise, memory use is displayed in MB.