Getting Started
Create an account
You can create a functionmetric account for free, simply:
- go to functionmetric.com
- click log in, and choose the sign-up option
- sign up with your email address and create a password, alternatively - log in with your Google or GitHub account.
Create an organisation
You'll be prompted to create your organisation, which you will be able to use to share metrics with your team.
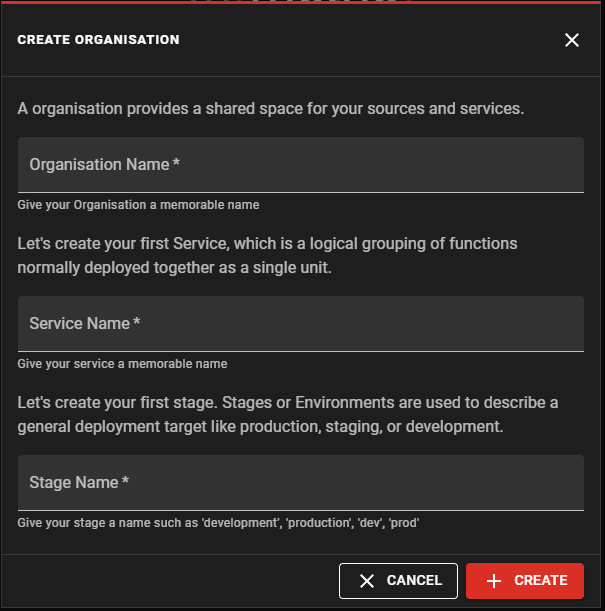
Enter your organisation's name, or for personal use, whatever you like!
You can also create your first service here, so enter the name of one of your applications you want to monitor. You can change this or add more services later.
You can also create a stage, which refers to the specific environment you'll be setting up first. Usually this will be something like 'dev', 'test' or 'prod'.
Integration, service and stage names must be less than 50 characters, can only contain upper and lowercase letters, numbers, spaces, dots, hyphens and underscores.
Connect your AWS account
You'll now be prompted to connect your AWS account. Simply enter a name for the account you'll be adding, and select it's region. If you have an account to separate dev and test environments from production, this might be something like "org-dev".
Click connect, and we'll generate you a link to follow which will create your integration in your account on AWS.
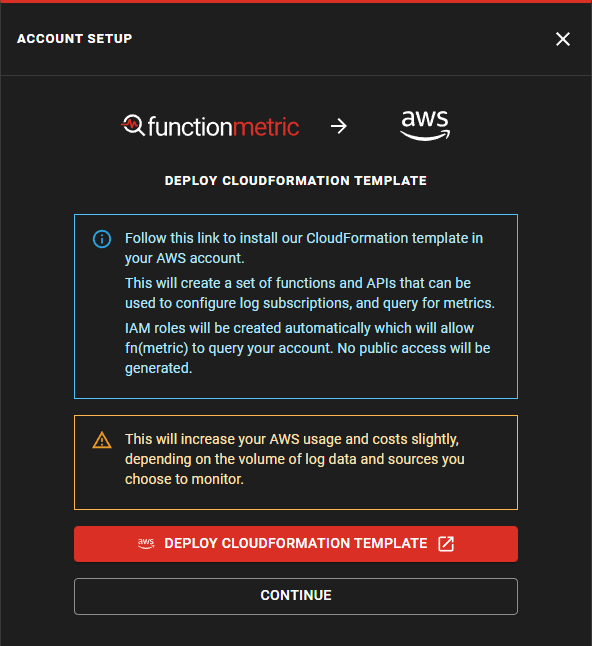
Follow the link to create the CloudFormation template.
Installing the CloudFormation template will increase your AWS Bill by a negligible amount.
Within AWS, Scroll to the end of the CloudFormation create stack page, avoid changing any of the pre-filled parameters. You'll need to check the box to acknowledge that the template will create IAM roles and policies to grant access to your metrics.
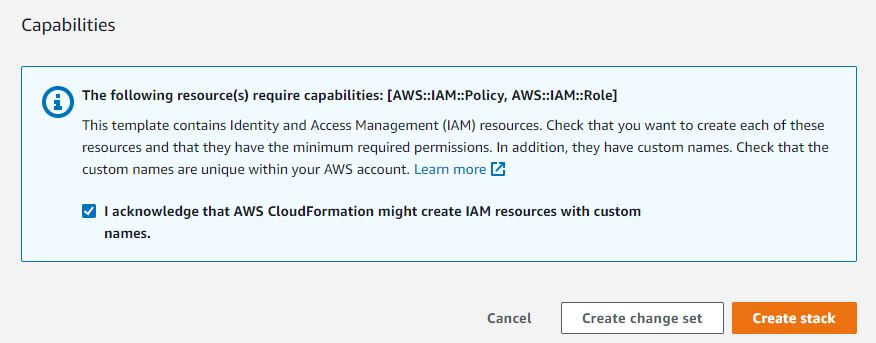
Hit "Create Stack". You can now return to functionmetric and click "Continue". functionmetric will now wait for your stack to finish creating, which might take a few minutes. When this completes, the page will update automatically.
You can add additional accounts later.
If you run in to any issues at this point, first check the CloudFormation events tab for any errors. If you need assistance, get help on Discord or contact us via email.
Configure functions you want to monitor
Each source you monitor will increase your AWS Bill depending on how often the function is invoked, and the retention period of data.
You'll now be able to see the detected metric sources in functionmetric. If you can't see all your functions yet, click the refresh button at the top right of the table to detect the available functions automatically.
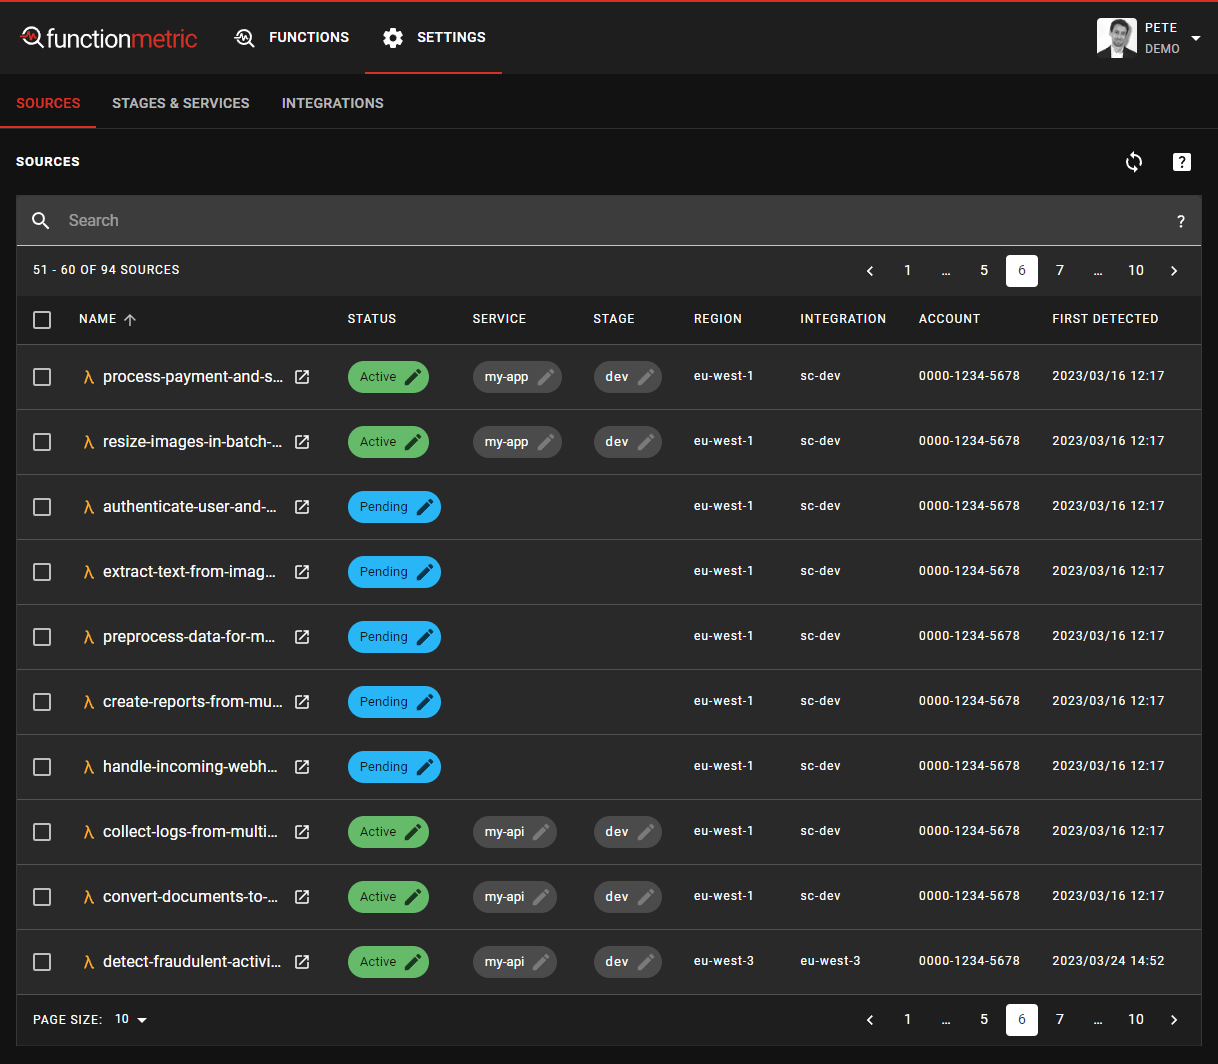
Select any functions you'd like to monitor and edit their status by clicking the blue "Pending" button.
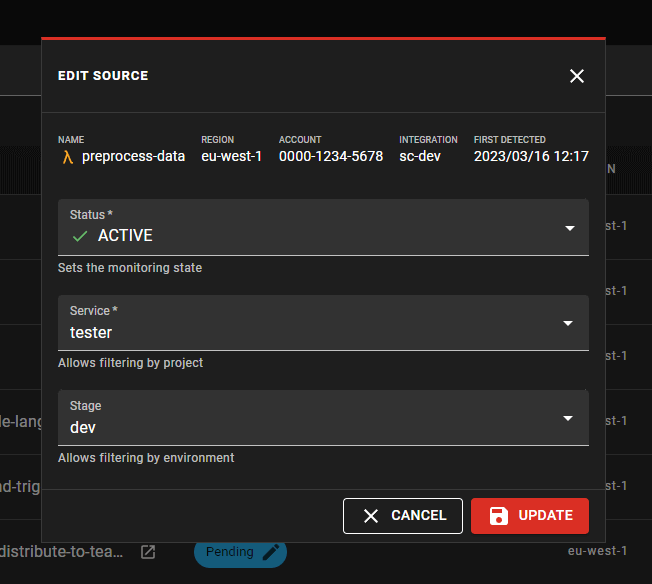
Set the status to Active, and select a service and stage for this function which will categorise and help you later to filter the log metrics you're interested in viewing.
If you encounter a "This log group has too many existing subscriptions" error, you can follow this guide to resolve the issue.
Multi-select
If you have several functions you would like to activate, deactivate or recategorise into a different service or stage, you can select them using the checkboxes to the left of each item, and then click the edit button at the bottom of the screen.
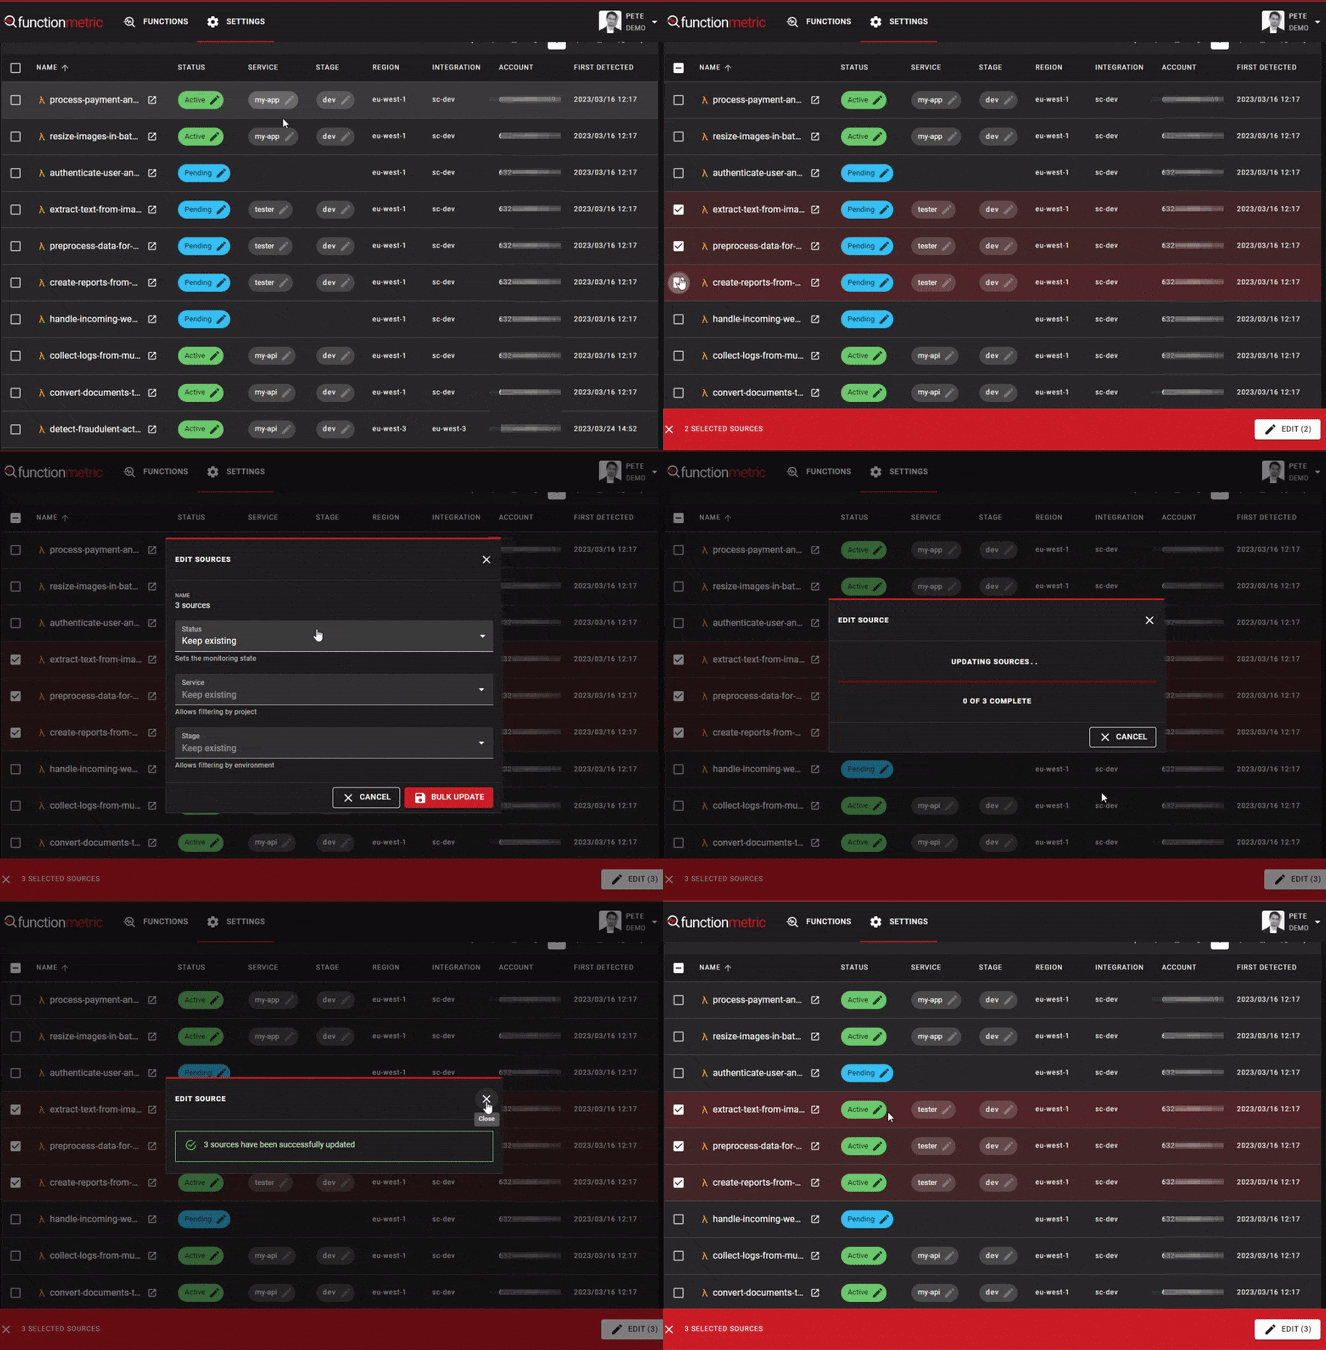
Your selections are preserved should you wish to use the search feature on the table.
Monitor your function executions
You can now click on the "Functions" item in the top nav bar, and you should see any sources you set to active in the previous step.
Depending on how often your function gets executed, metrics might not appear straight away. If you can, execute some of your functions to check that you can see the invocation count increasing.
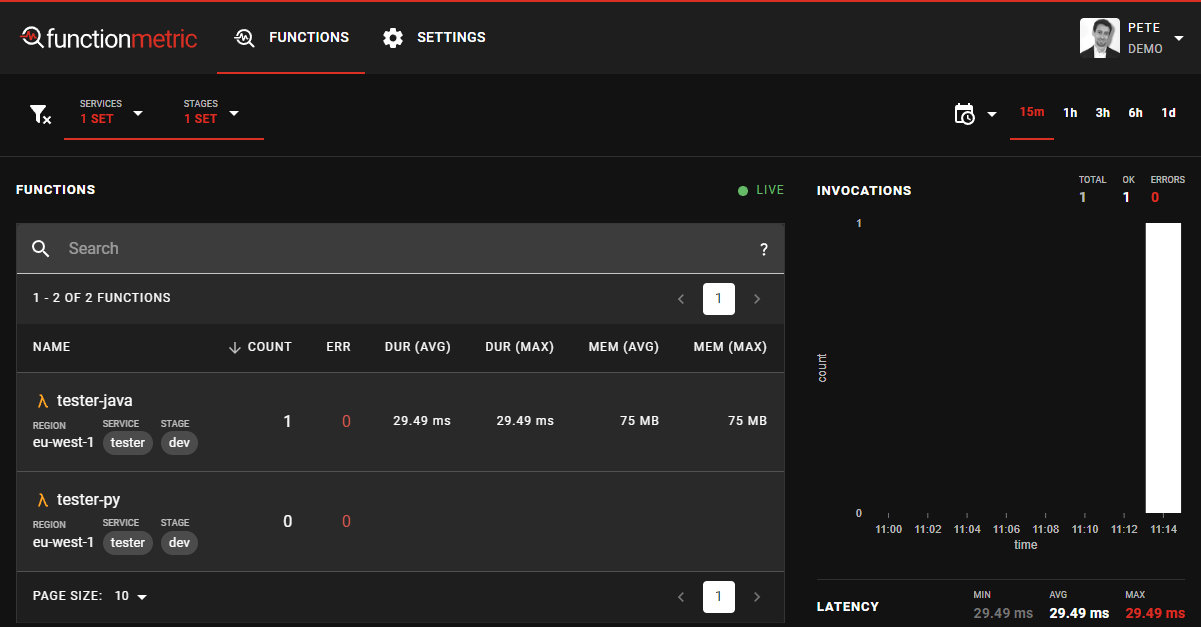
That's it! You've set up your first integration with functionmetric!
Read more about how you can filter this view, and the available metrics.