Functions
The functionmetric "Functions" view shows you statistics and graphed metrics for the functions you've chosen to monitor, based on the sources you've configured.
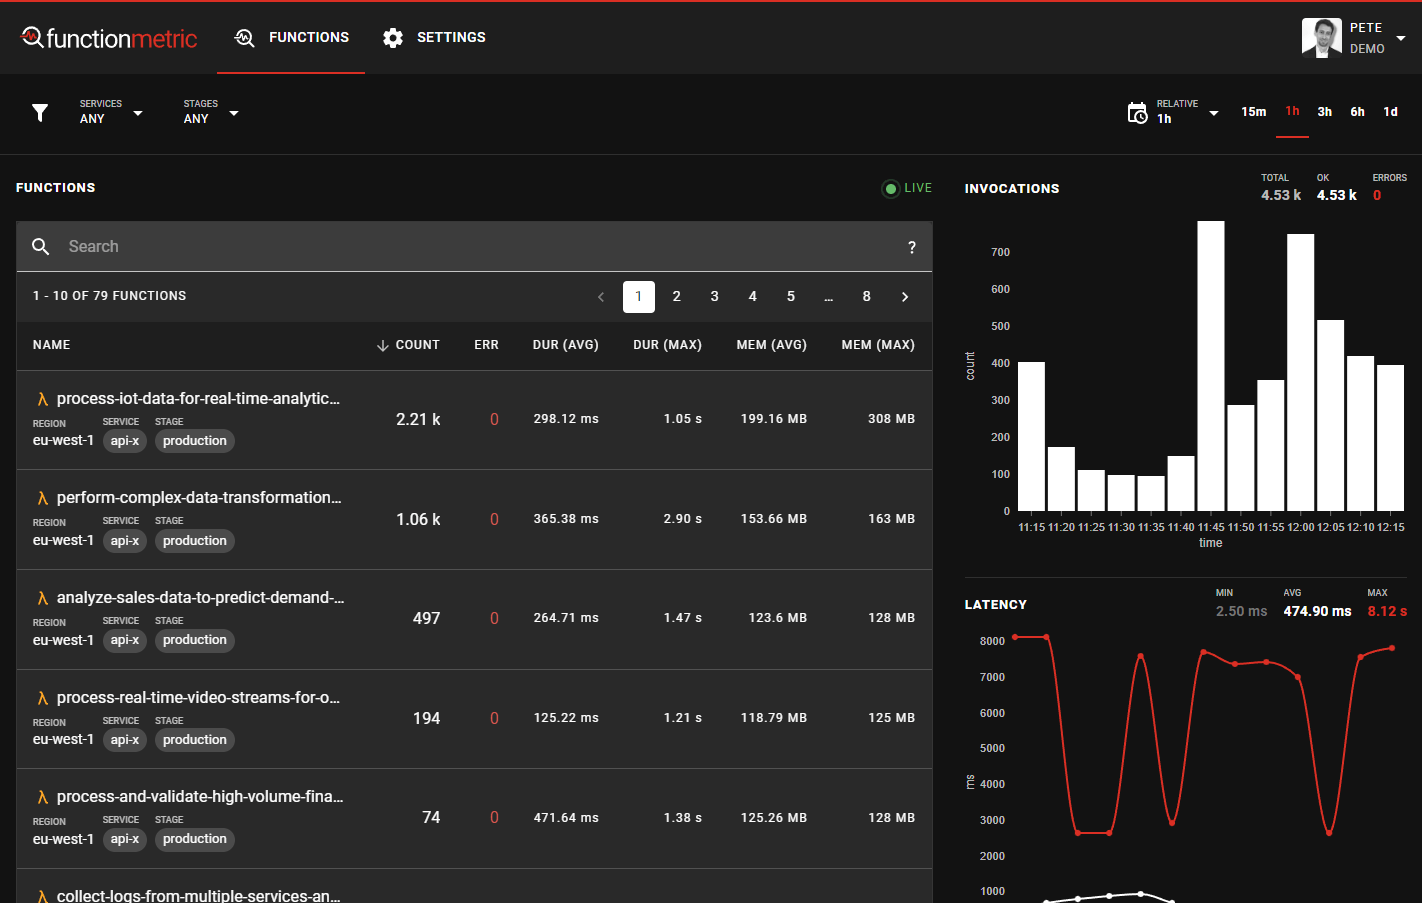
Filter by service or stage
You can filter this view to only show functions for specific stages and/or services you've associated with each function source.
When you make a selection or deselection, The functions table and graphed metrics update to show only function data for your selected stages and services.
Adjust time range
You can adjust the time range to view data for, to show recent or older data.
Simply select a preset relative time from the available options, and the data will be automatically filtered.
There's no need to refresh the page for the latest metrics, by default, the UI will automatically update.
Relative time range
If you want to view a more specific time range, clicking the time dropdown provides options to specify the exact time range you want to view.

The "Relative" tab shows options for relative time ranges to now. For example, selecting 1 hour will show the last hour of metrics.
Turning off "Real-Time Auto Refresh" will show a relative time range up to the time that you click "Apply". In this case, the newest data isn't automatically refreshed, you'll be viewing a static time window.
Absolute time range
If you need to see data for a specific period, click the "Absolute" tab, and enter the start and end date/time to view metrics for. The metric data will be filtered for the time range you provide.

Inspect a specific function
You can see statistics about the individual functions within the table on this page. To inspect a particular function, click on it's name.
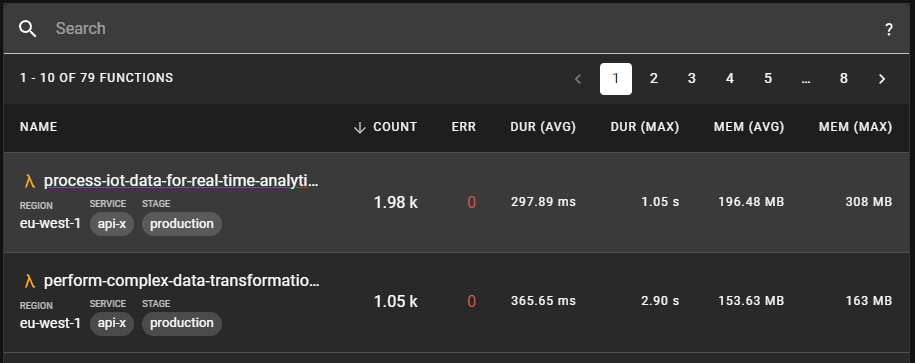
If you're looking for a specific function, you can use the search filter above the table to filter the list of shown functions.
Continue reading to learn about the individual function view.