Function Details
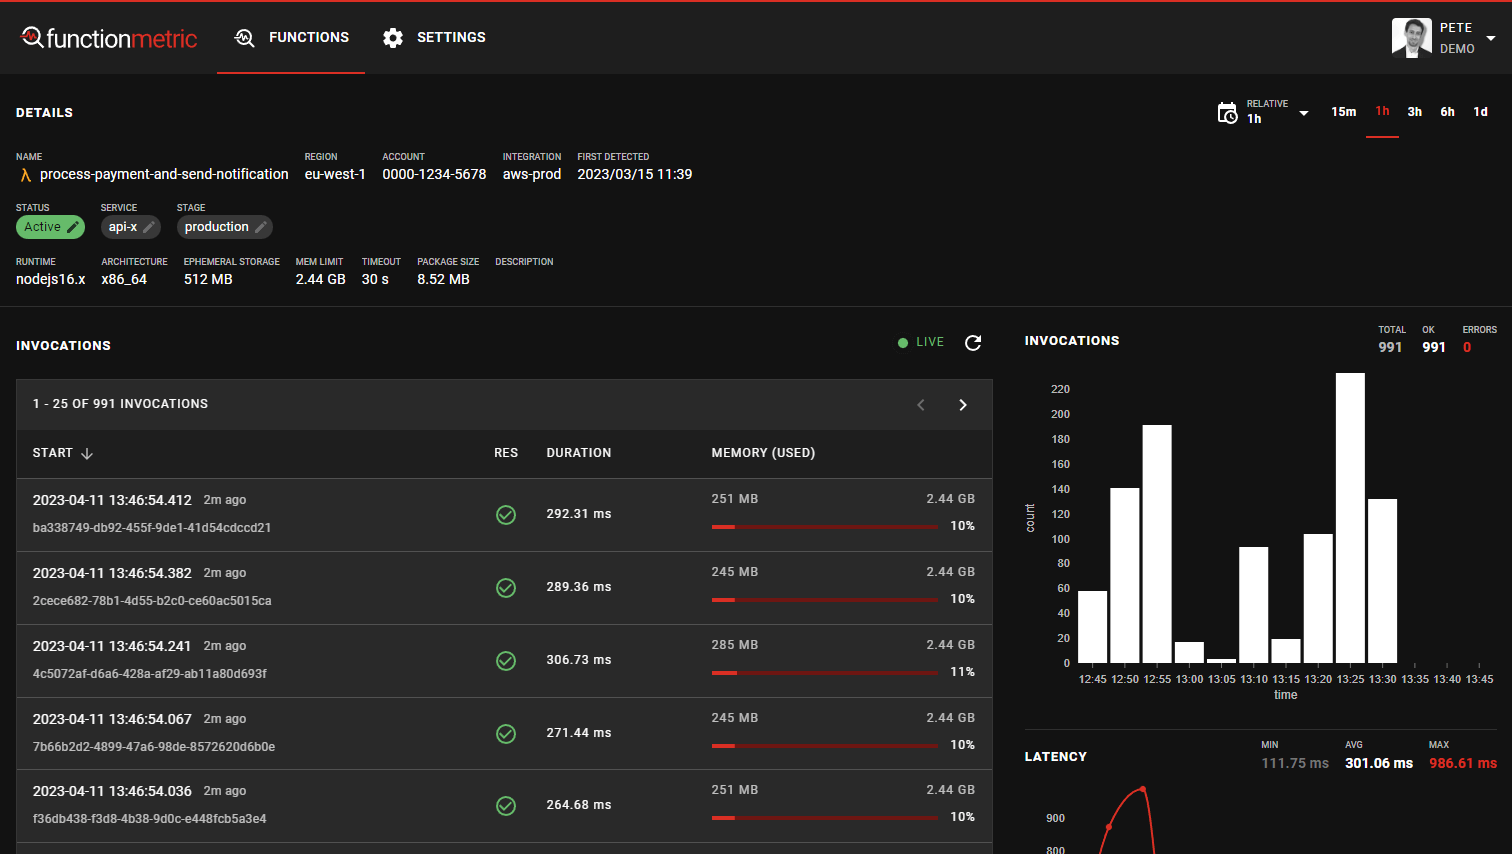
Clicking on a function in the functions list takes you to this page.

Here, in the Invocations table, you can see each individual invocation of your function. By default, the most recent invocations are shown at the top.
The graphed metrics on this page are only for the individual function you're viewing.
Inspecting an invocation
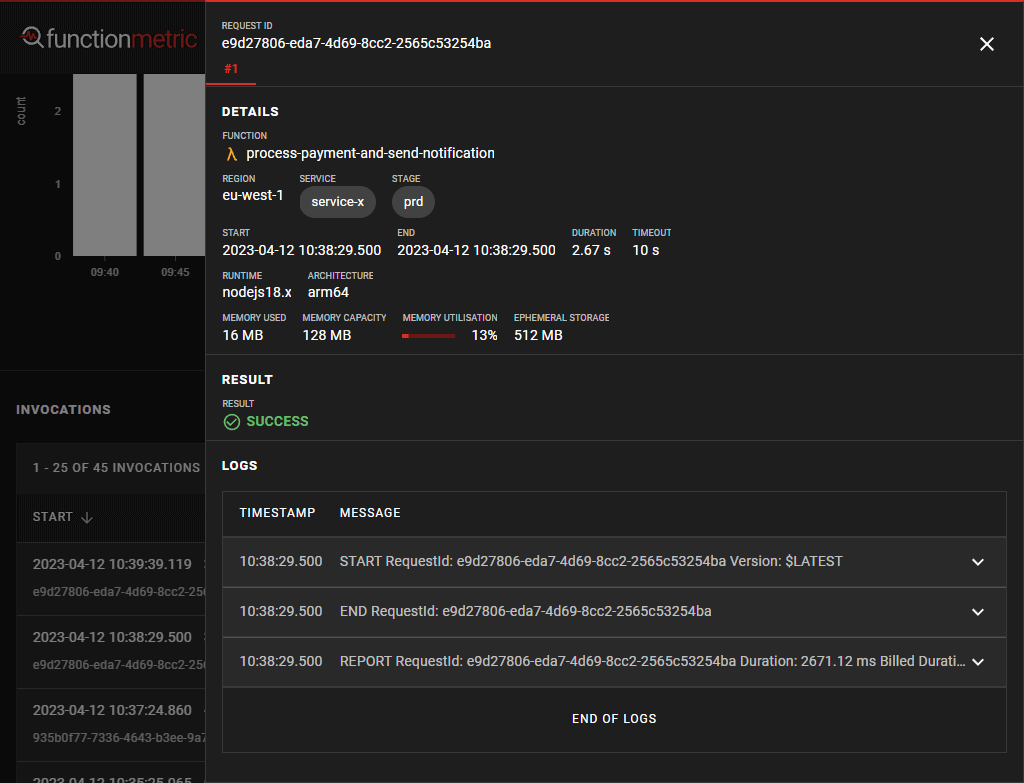
To look at the stats and logs for an invocation, click on one of the invocation times/IDs in the table, this brings up the invocation details.

The details about this invocation are detailed here.
The exact start (and end time, duration and memory use if complete) are shown. If this invocation was a cold start, this is flagged next to the duration.
Below these stats, we show the result of the invocation (success/fail, http status code), if and when it is possible to determine.
Beneath this, you can see the log data for your invocation. If it's still in progress, this is a 'tail' view, which will automatically update as more logs become available for your invocation.
Retries
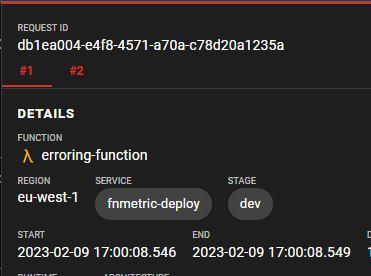
When a function fails to run, and is retried, AWS assigns it the same Request ID. You can view these separate invocations in functionmetric by clicking on the tabbed numbers at the top of the function details.
Invocations which are retried are presented as separate rows in the invocation table.
Invocation retries are presented in chronological order.
